Demographics
2021 BC child report card:
This demographic talks about how minimum wage is affecting children who are in poverty and those with low income. It is also talking about how renters would have a hard time getting an apartment while working minimum wage.

No one left behind:
This demographic talks about how Covid had had a major loss on income and how low-income mothers and single parents are at disadvantage by Canada market-based childcare model.
Poverty reduction grants addressing local needs in Kamloops:
In this demographic it states Kamloops’ poverty reduction grants and how much money each local government received to make poverty reduction plans.

Facts about global child poverty:
This demographic was about facts about child poverty globally.
COVID pushes millions more children deeper into poverty, new study finds:
This demographic talked about how children who do not receive an education are forced to get married at a very young age or are forced into child labor. This demographic also had talked about how there are over 1.2 million children living in poverty.

Impact of COVID-19 on children living in poverty:
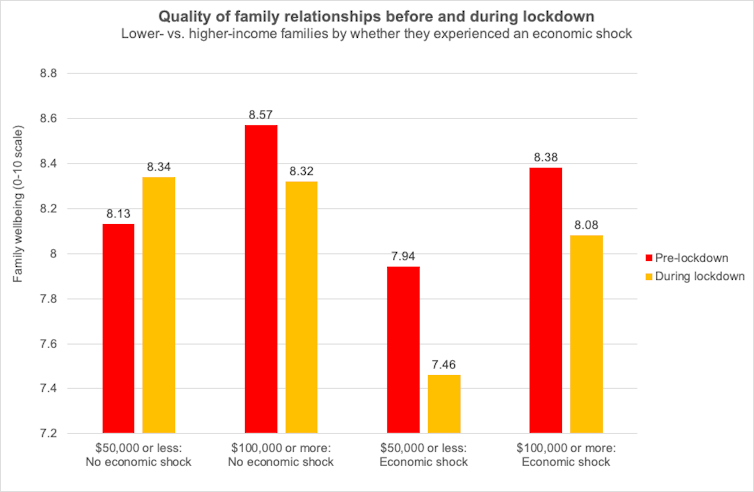
This demographic had talked about covid and its effects on child poverty. as well as how children could possibly be living in multidimensional poverty compared to the pre covid situation.
